
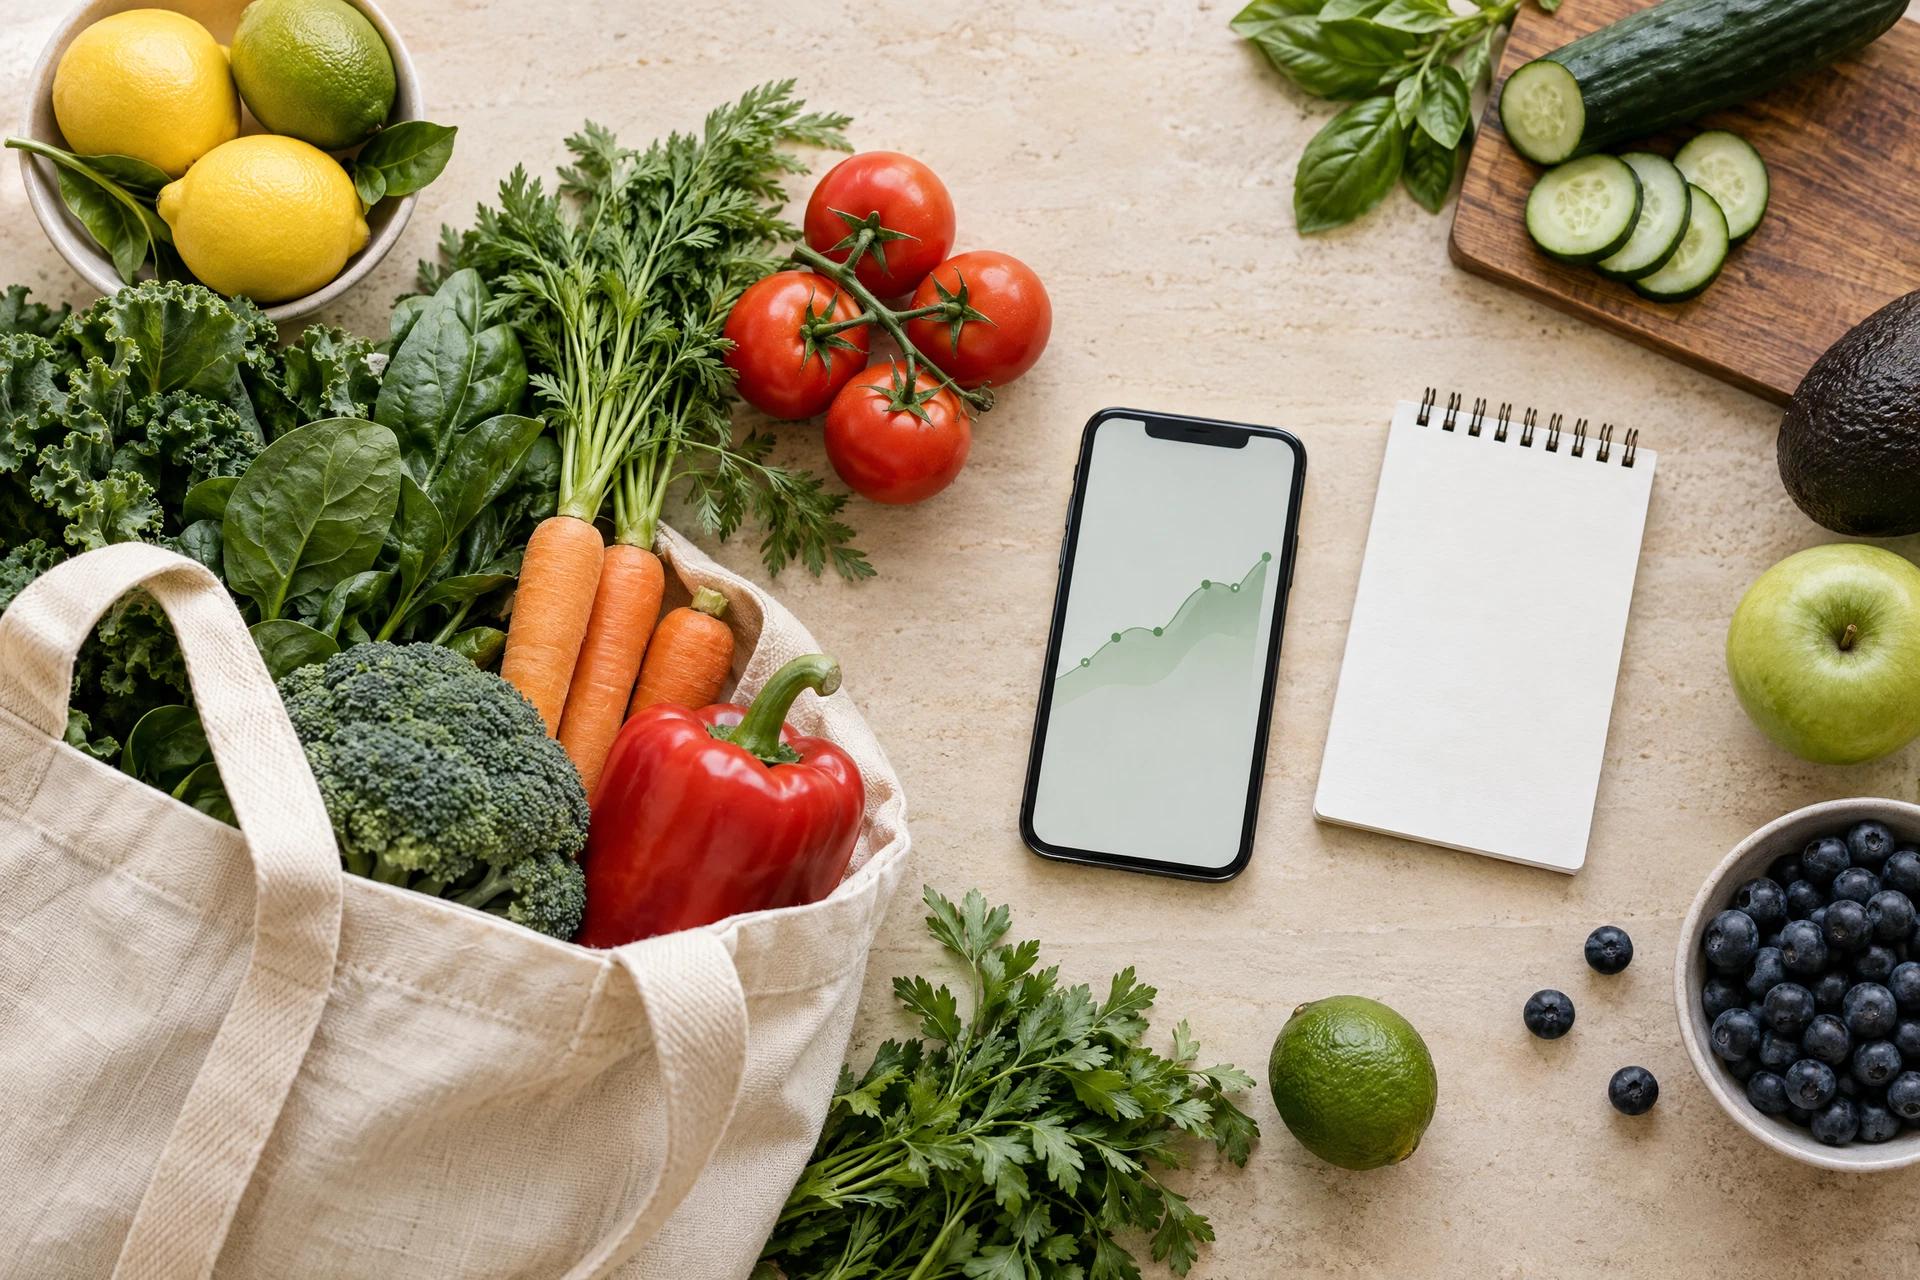
01 PLAN
Shop with a budget in mind.
Organize lists, set a budget and estimate what your recorded shopping could add up to over time.
Make everyday spending easier to see
Build a shopping plan, keep an eye on prices and see spending in the currency you use. Stackside brings everyday decisions into one clear view.

A little more clarity, from aisle to pump
Start with what you want to buy. Keep the costs and changes that matter close by.
01 PLAN
Organize lists, set a budget and estimate what your recorded shopping could add up to over time.
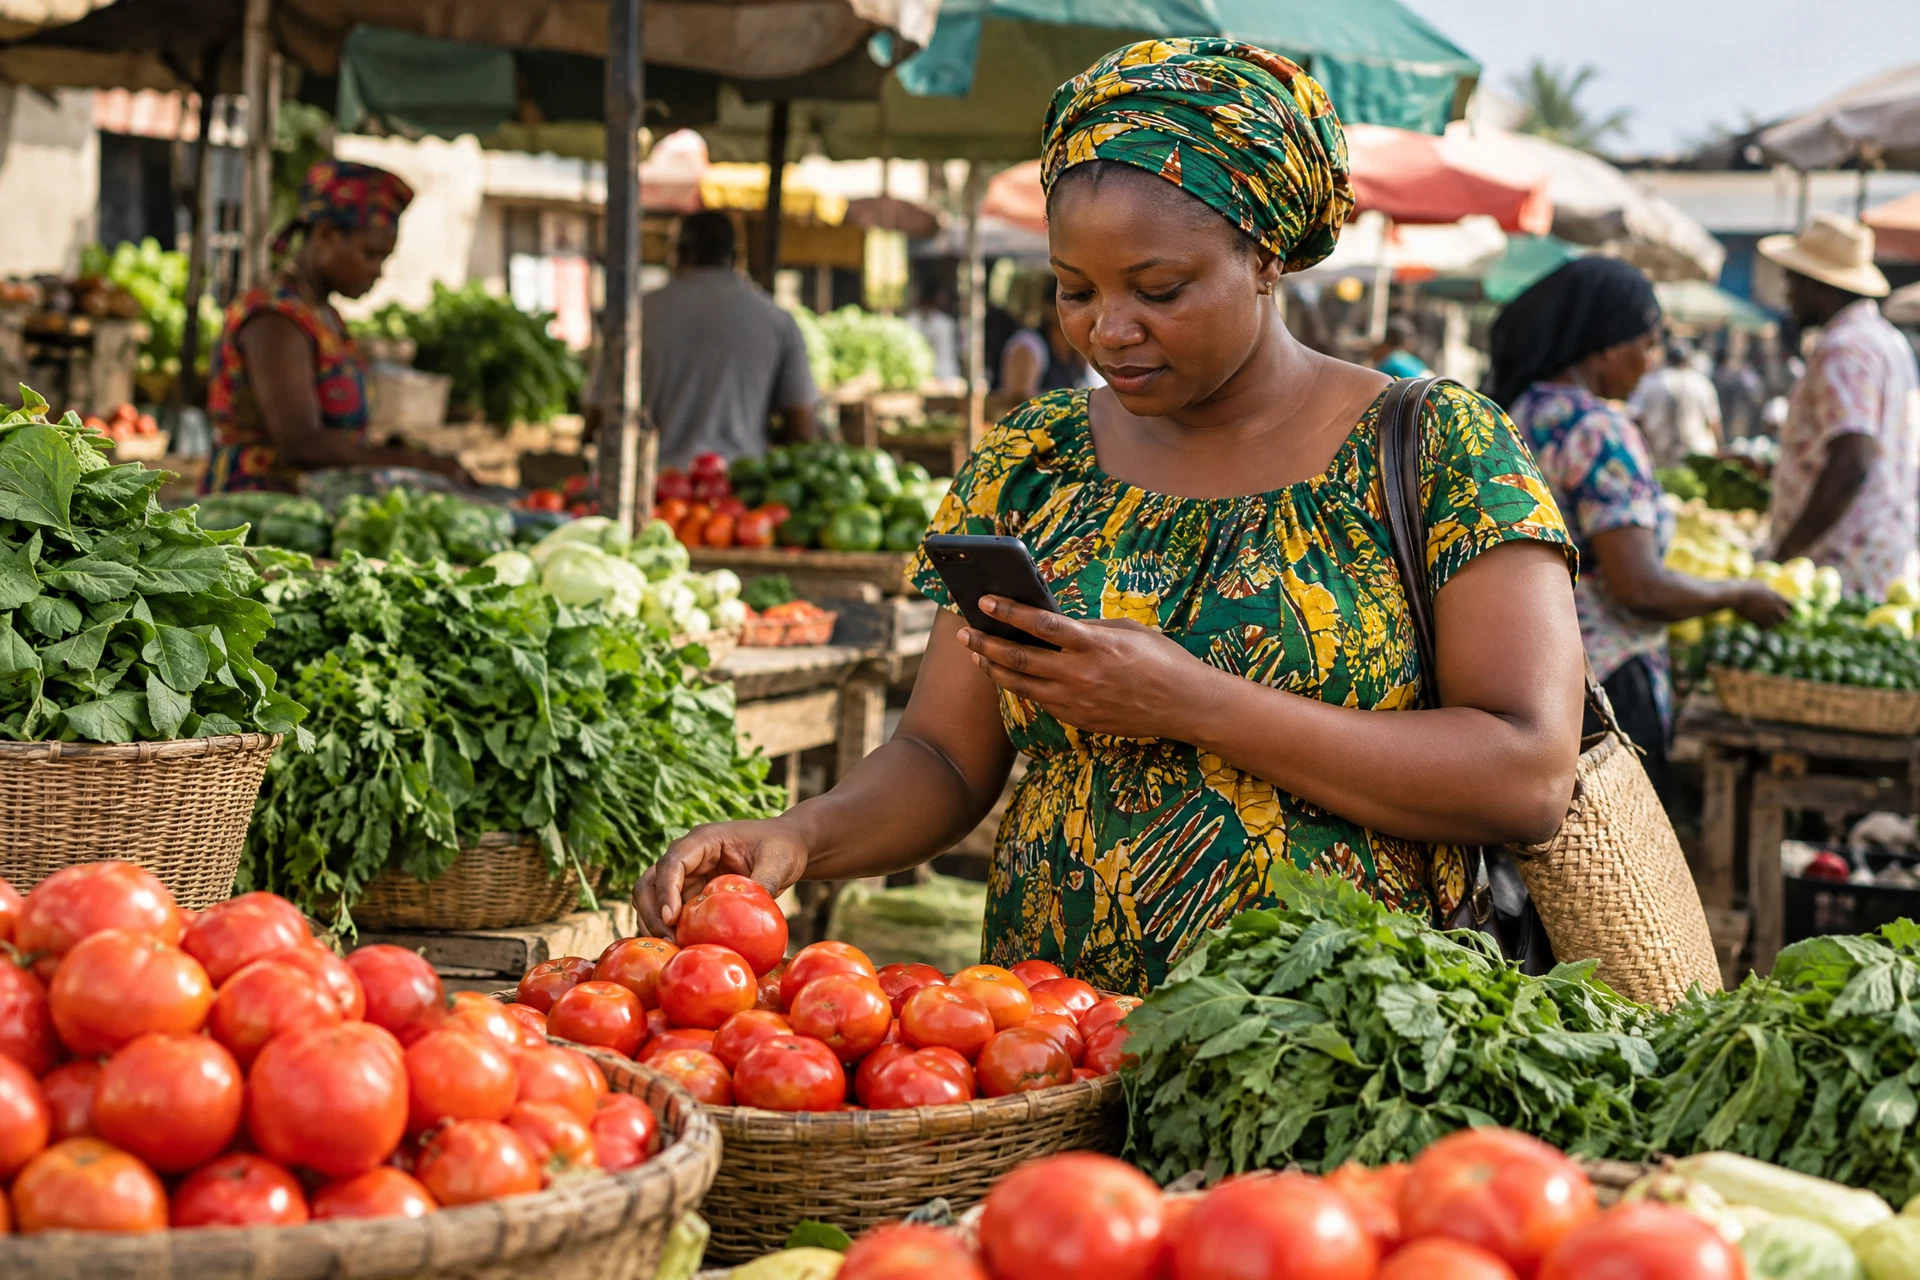
02 FOLLOW
Switch currencies, compare example markets and search regional headlines for the products or prices you care about.

03 TRACK
Explore dated gasoline and diesel history, then add your own local readings to see how prices move.
A look inside Stackside
After you sign in, your dashboard brings together your own shopping lists, spending pace, price targets and fuel notes. This sample is only here to show the kind of view you can build.
Go to your dashboardOat milk targetExample price below £2.00
Fuel historyArchived context · not a live quote
Sample only. Your signed-in dashboard starts with your own records.
Price signals, made easier to follow
See money totals in a supported currency, search news from a chosen country and keep a watchlist of prices you want to revisit.
Open your workspaceKnow what you’re looking at
Supermarket prices and stock examples are illustrative, not live retailer feeds. Exchange rates are sourced daily. News headlines link to publishers and are not verified shelf prices. Fuel history is an archive through April 2025; you can add current observations yourself.